Nodes Management
The view provides a centralized view of all cluster nodes and their current operational status. This interface allows administrators to monitor node health, manage configurations, view logs, and perform maintenance tasks across the entire cluster. Each node's status type is displayed in an organized table format for easy monitoring and management.
Cluster View
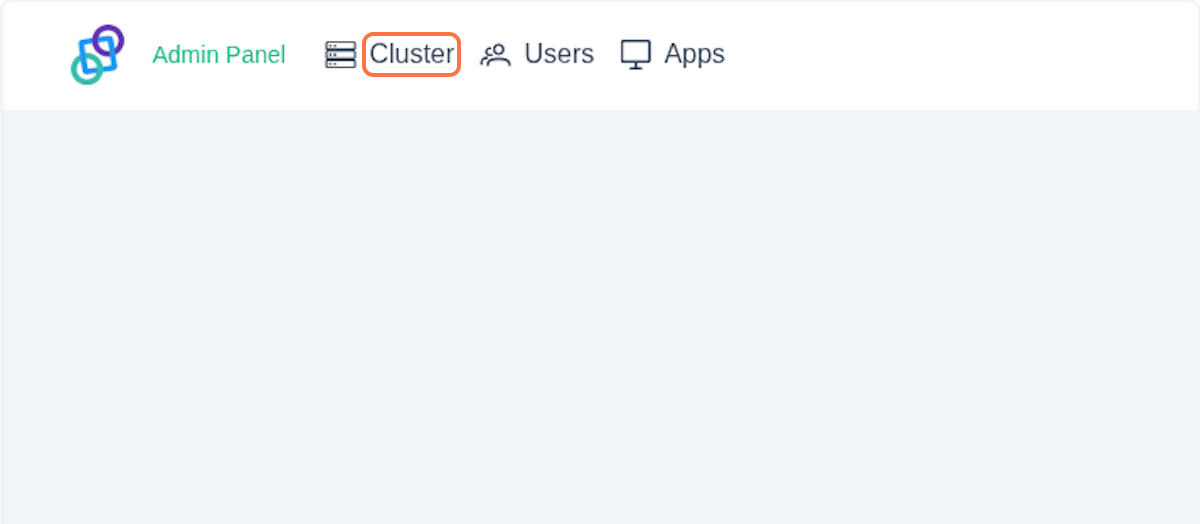
Click on Cluster button.
The Nodes section should appear.
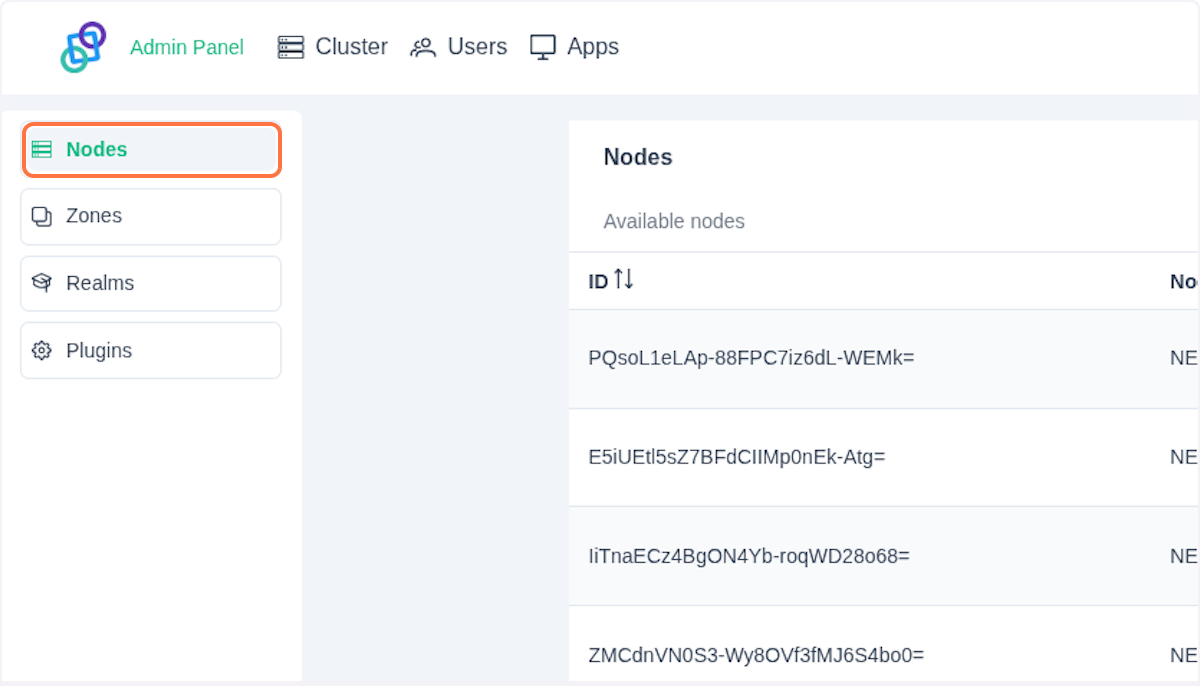
In the Nodes section, you can see a table listing all your nodes (excluding the admin node). Each table entry contains the following data:
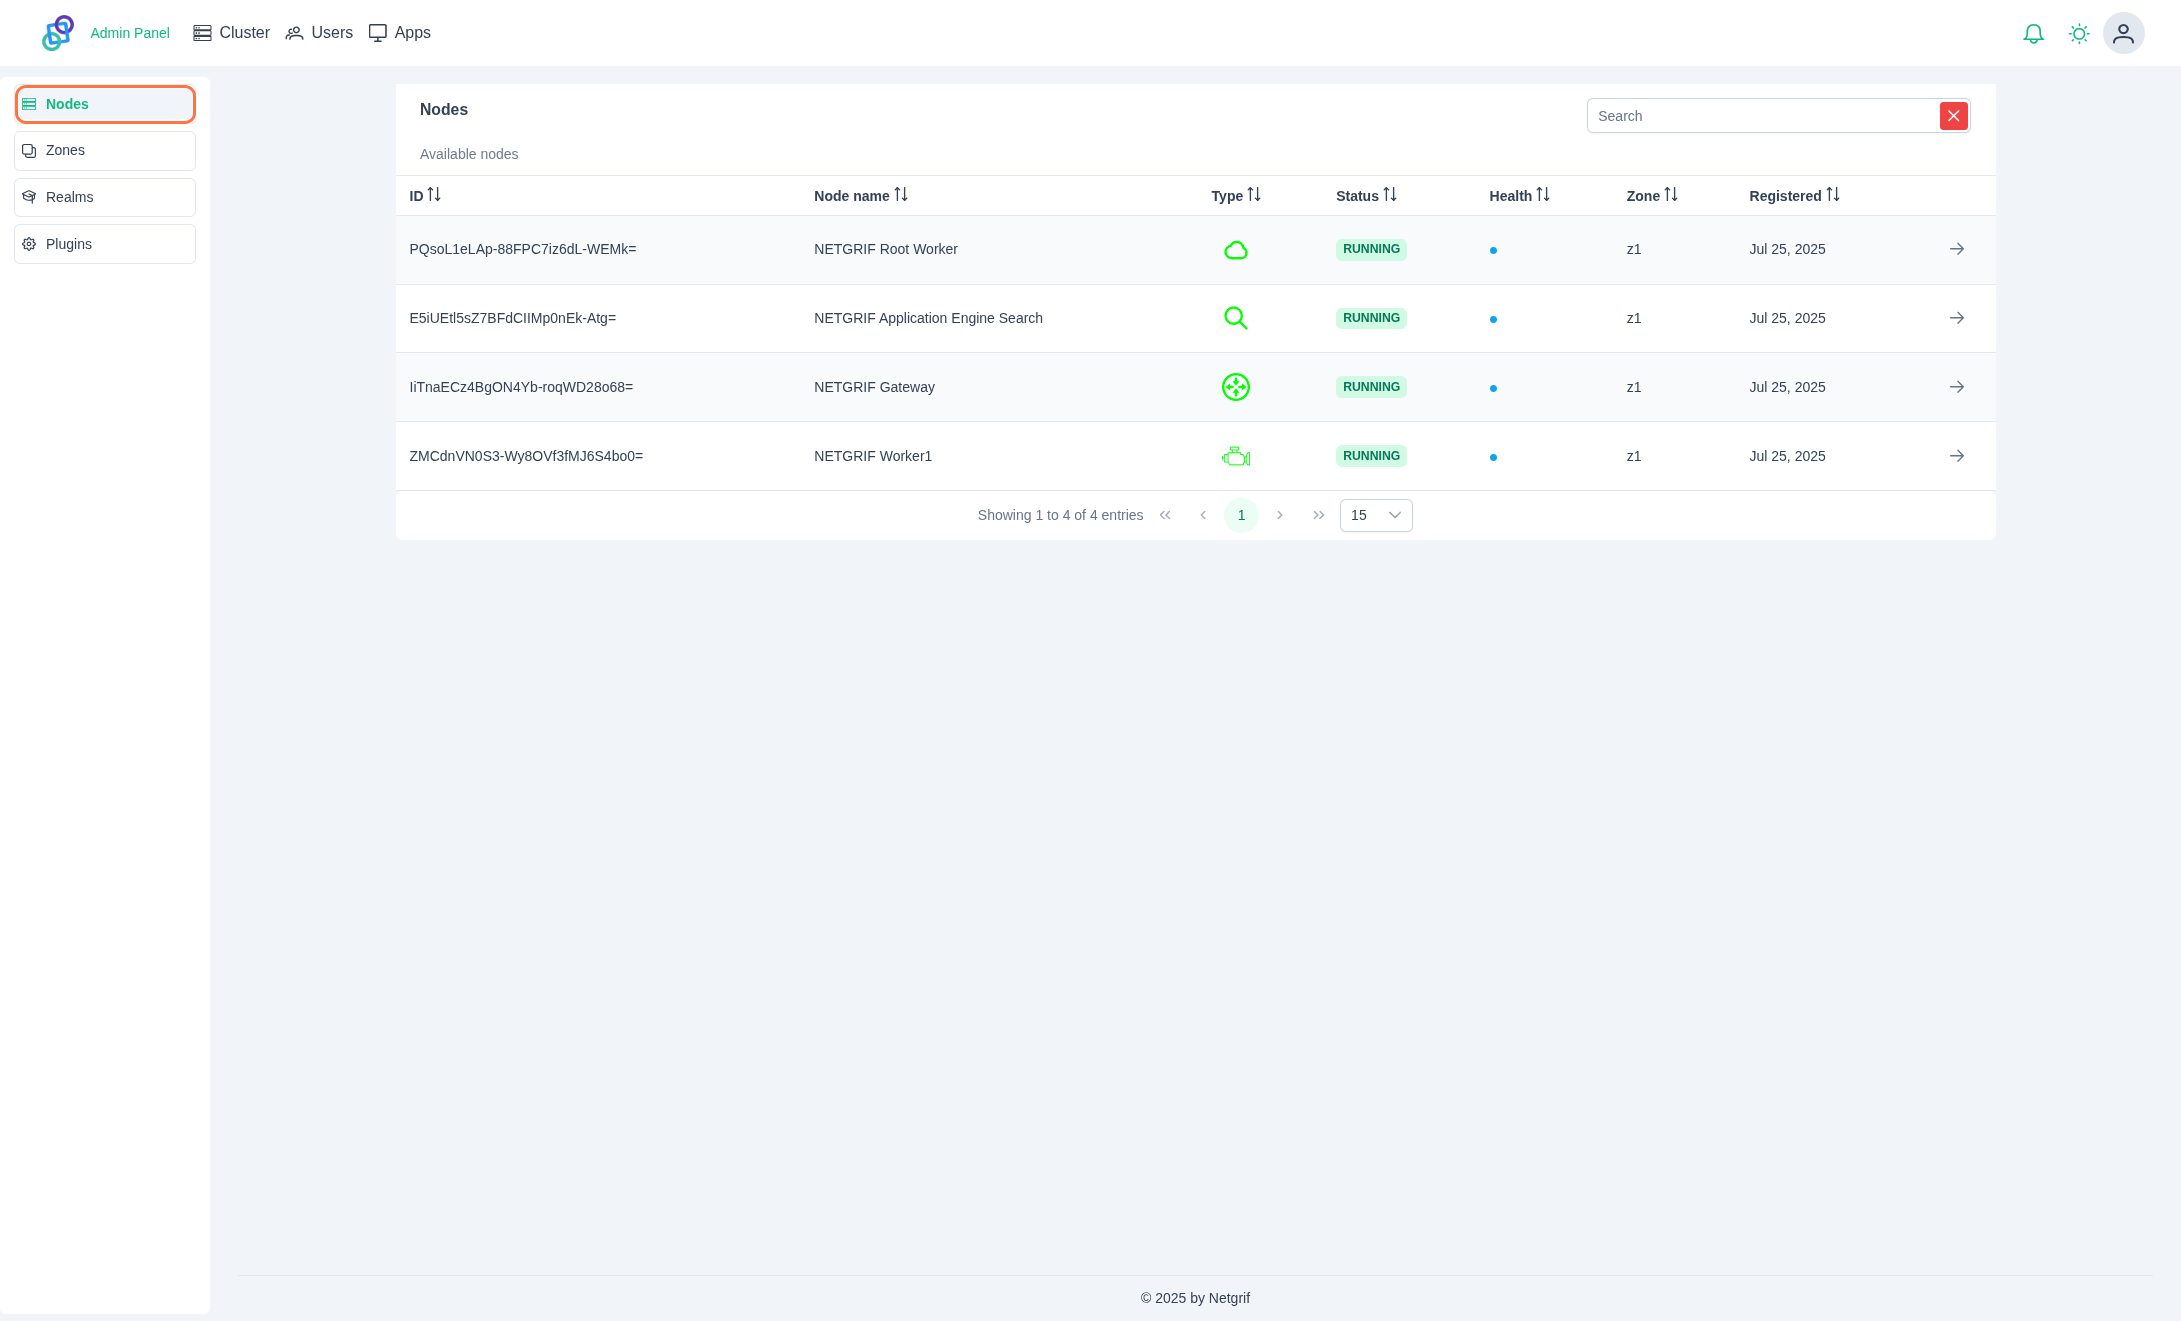
ID: Unique string identifier of Node
Node name: Human-readable name of Node
Type: Icon representing a type of node
- Root Node
- Search Node
- Worker Node
- Gateway Node
State: Current State of Node
RUNNINGSTOPPEDPAUSEDSTARTINGSTOPPINGERRORMAINTENANCEUNKNOWN
Health: Node health value
- 🔵 UP
- 🔴 DOWN
Zone: The node’s current zone.
Registered: Date of node registration to admin
General Node Details
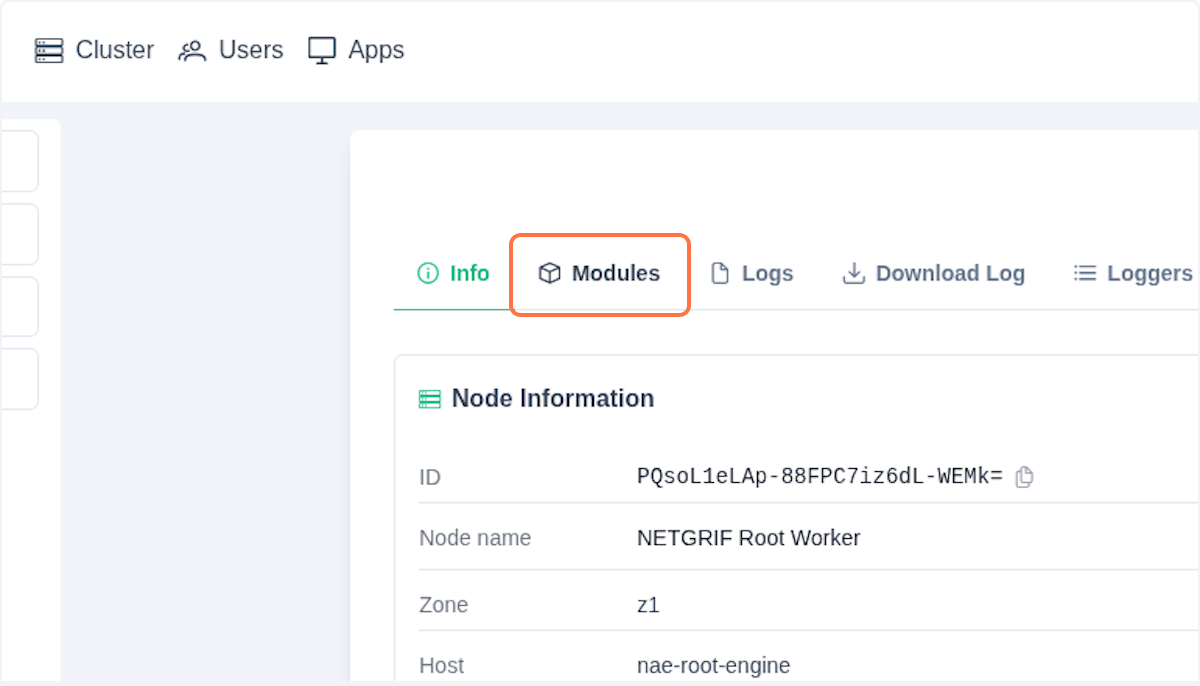
Click on the button in the table entry to view Node details.
![]()
You are currently in the Info section. Here you can find all important information about the Node. The Node Information tab is divided into two sections.
- Node Information
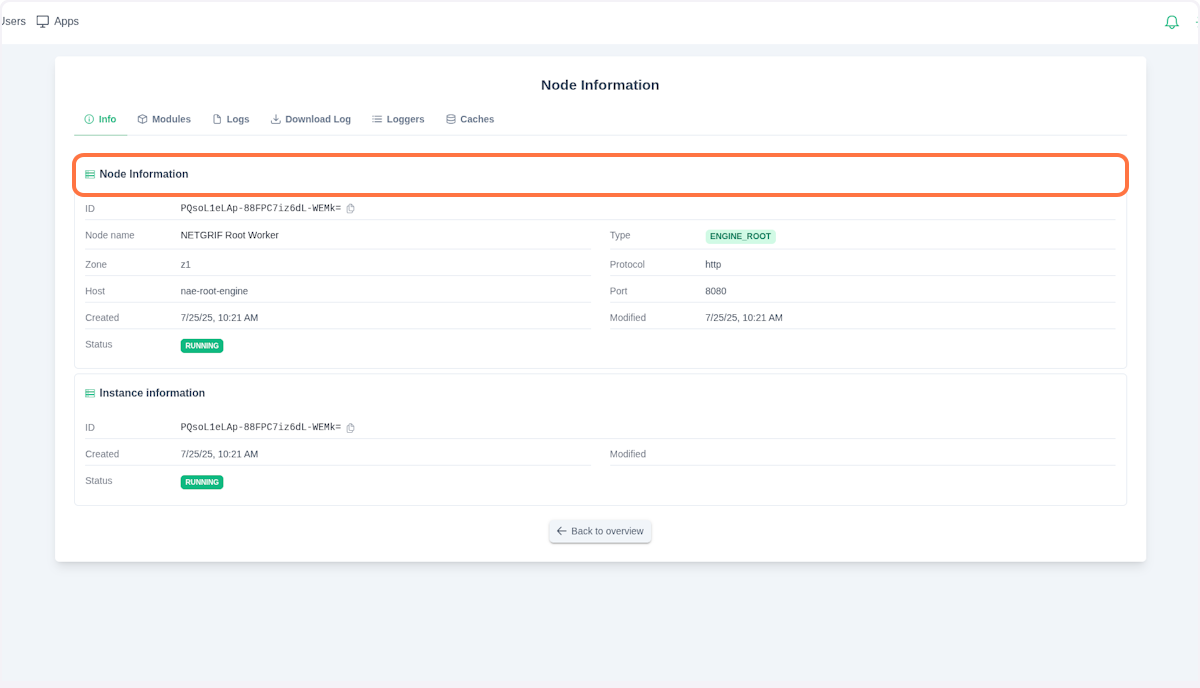
- Instance Information
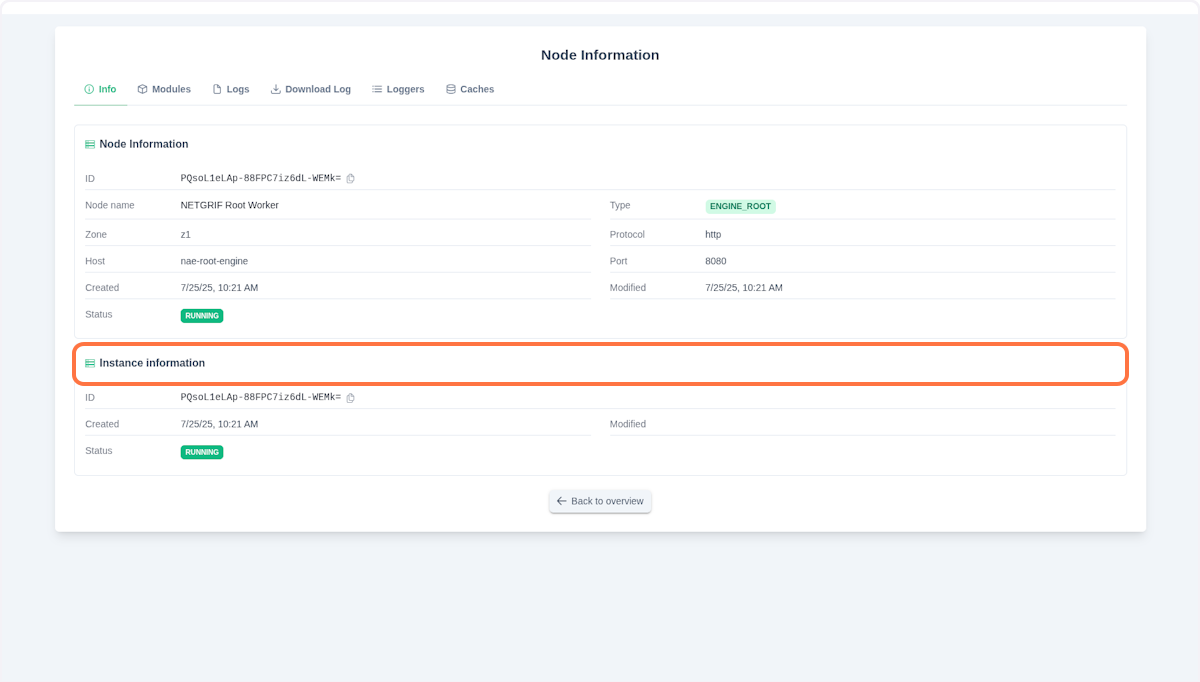
If you are using our SaaS model, or a configuration with inCloud: true, then the Node and Instance sections will differ. At the top of the Node Information tab, you can see a menu with additional details:
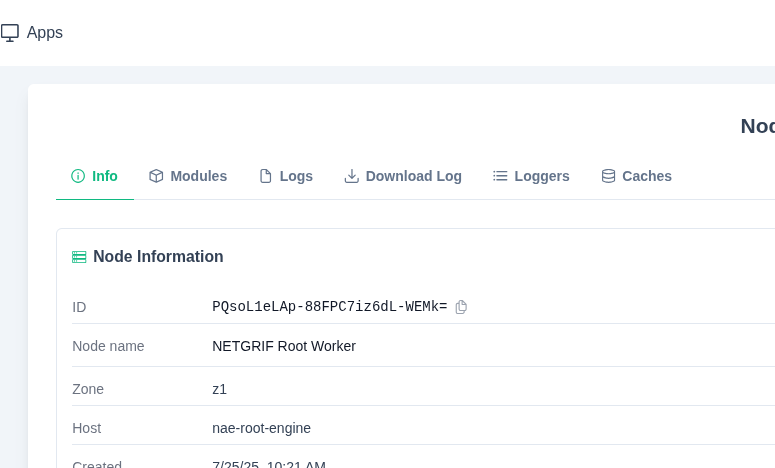
- Info: General Node information
- Modules: Loaded Node Modules Logs: Live logs of the Node
- Download Logs: Download historical logs in ZIP format
- Loggers: Logger Controller, control levels of loggers and turn on/off loggers
- Caches: Cache Controller
NOTE
A Node Instance represents a copy of a Node with its own unique identifier. It operates as an independent replica while providing the same functionality as the original Node. In the Admin interface, you can select and manage different instances of the same Node across all available tabs. This is especially useful when multiple instances of a Node type are needed for workload distribution or redundancy.
The instance selector allows you to switch between these replicas and view their individual states, configurations, logs, and loaded modules.
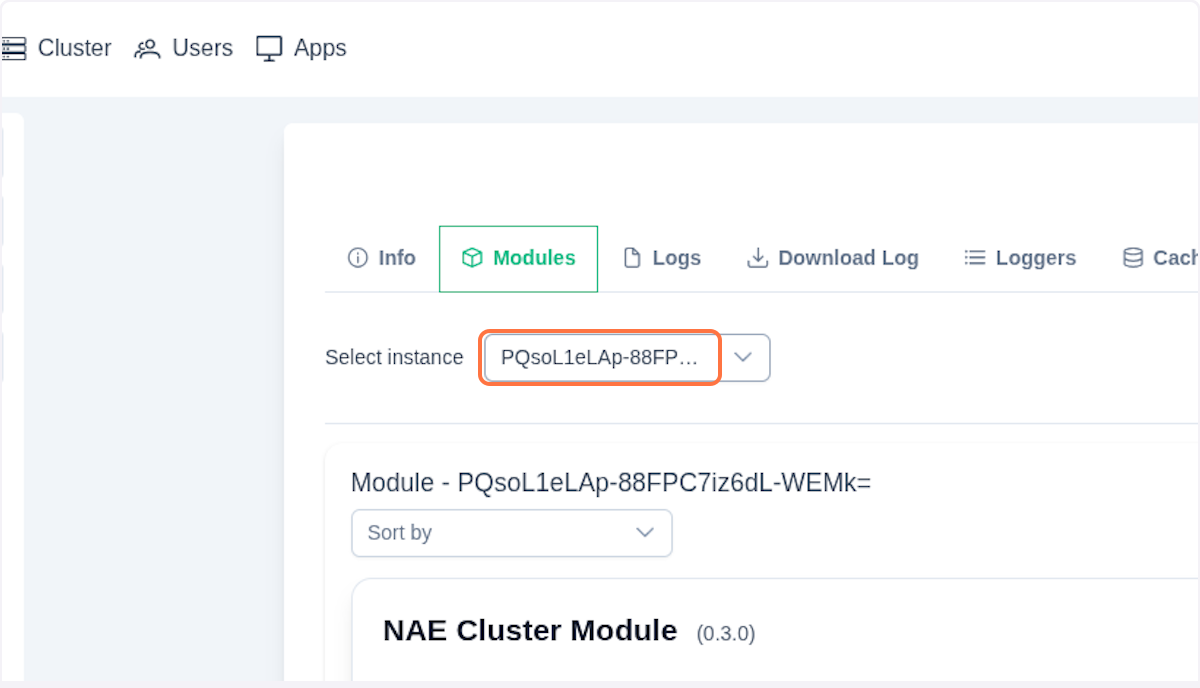
Node Modules
Click on the Modules tab.
Here you can see all modules that are currently loaded to your node.
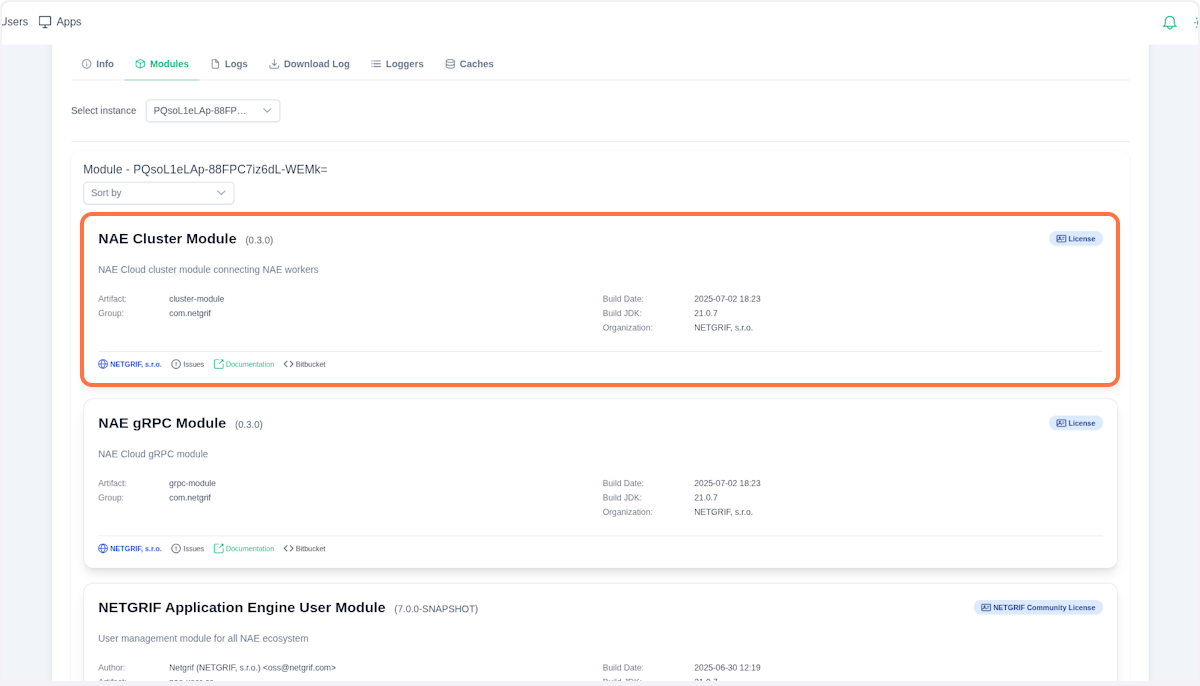
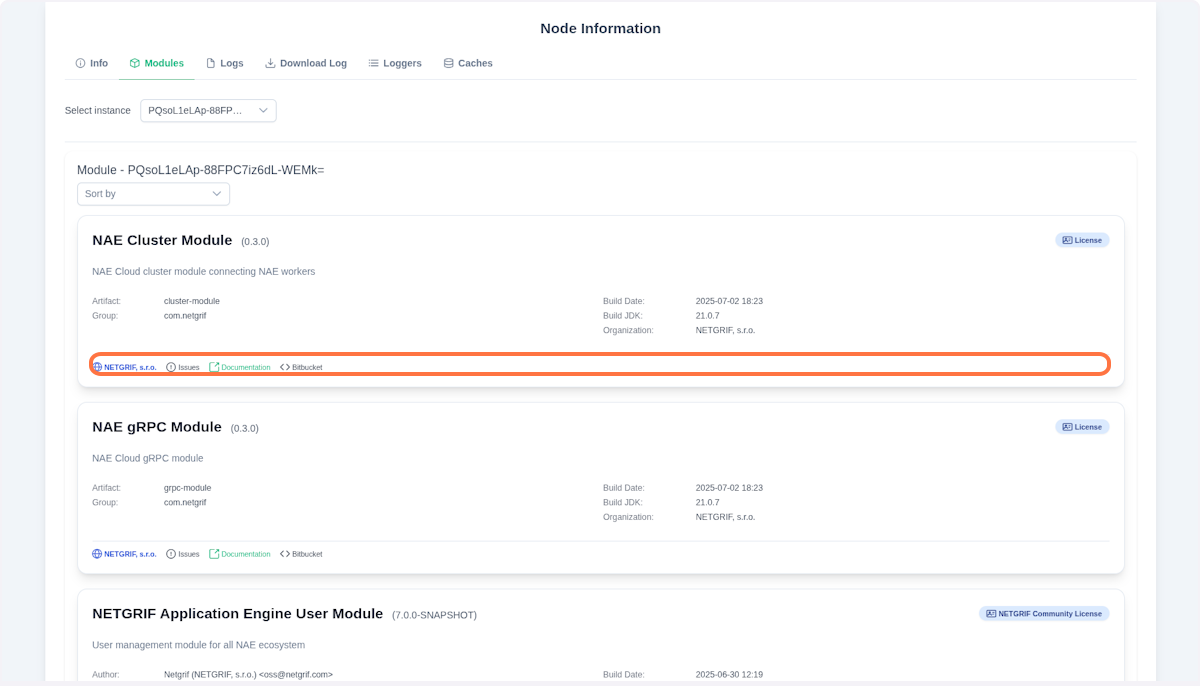
Each entry contains general information about the module, including its name, version, and origin developer. The bottom tab contains links to additional information such as documentation, source code, or issue tracking page. You can use these links to learn more about the module's features and implementation details, or to report any encountered issues.
Logs/Download Logs
Click on the Logs tab.
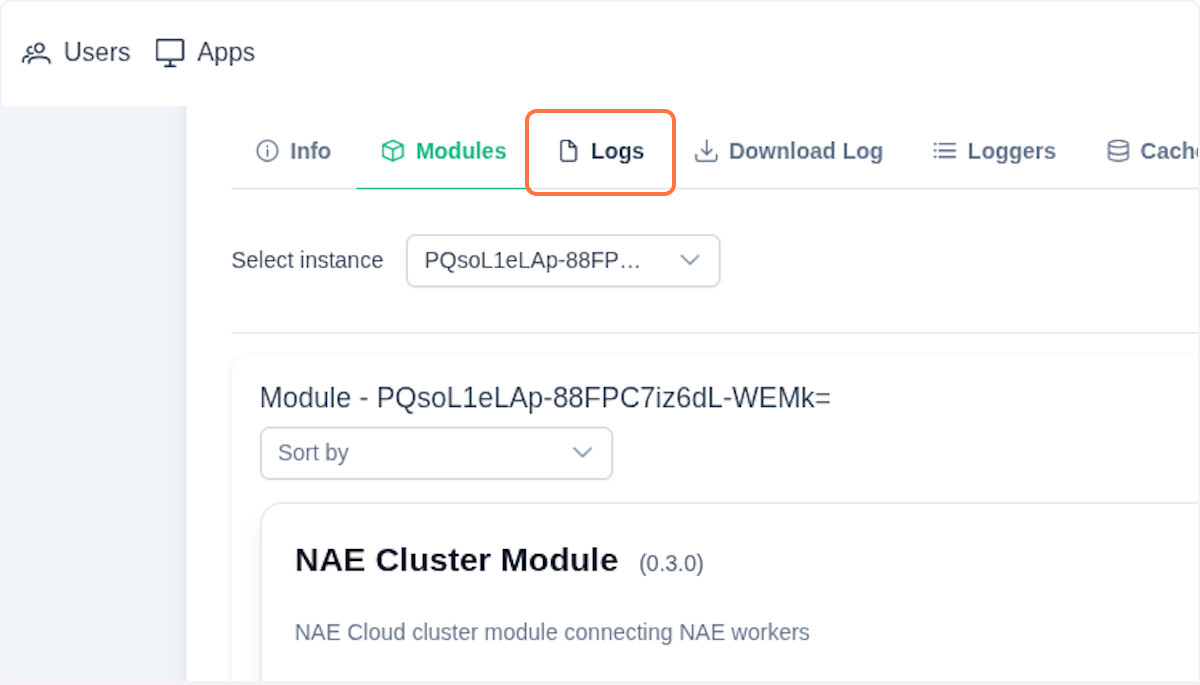
Now you can see live-streaming logs from the selected node instance. The logs are automatically updated in real-time as new log entries are generated. You can use the search bar to filter logs by specific text or use the log level filter to show only specific types of logs (INFO, WARN, ERROR, etc.).
The log viewer keeps the latest log entries in view (currently opened a rolling file). Older logs can be accessed through the Downloaded Log tab, where you can download historical logs as a ZIP file. By default, the log files are retained for 14 days. Each Worker uses Logback, so you can adjust logging to your needs, either programmatically or through logback.xml.
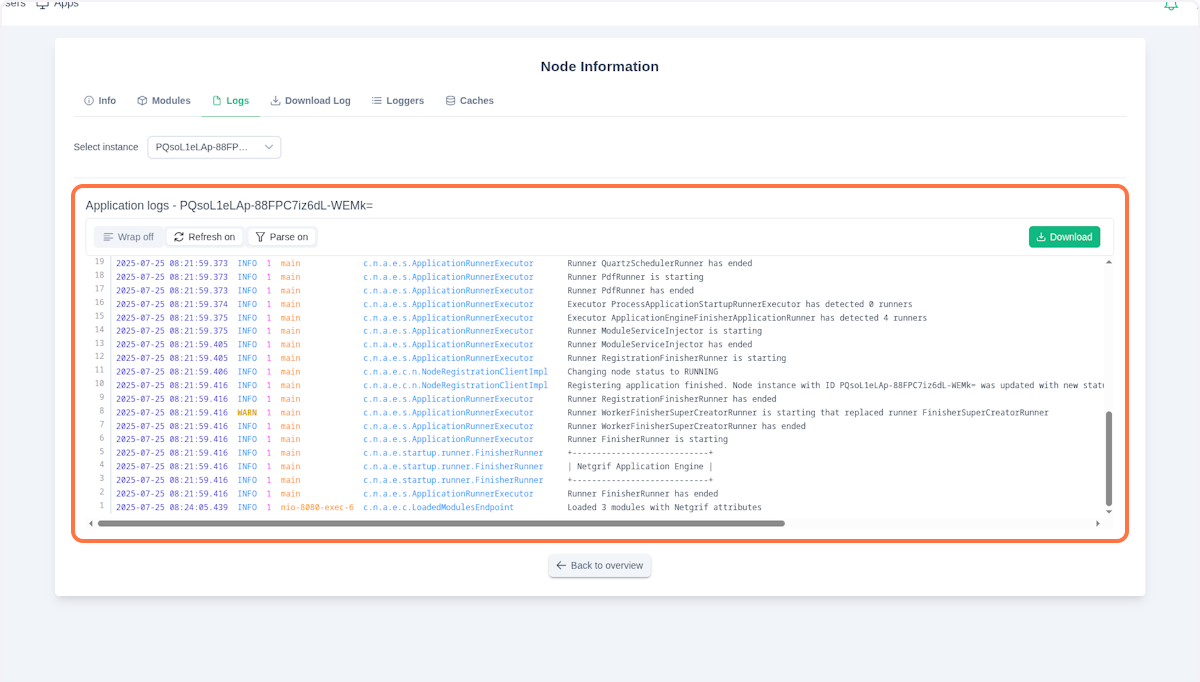
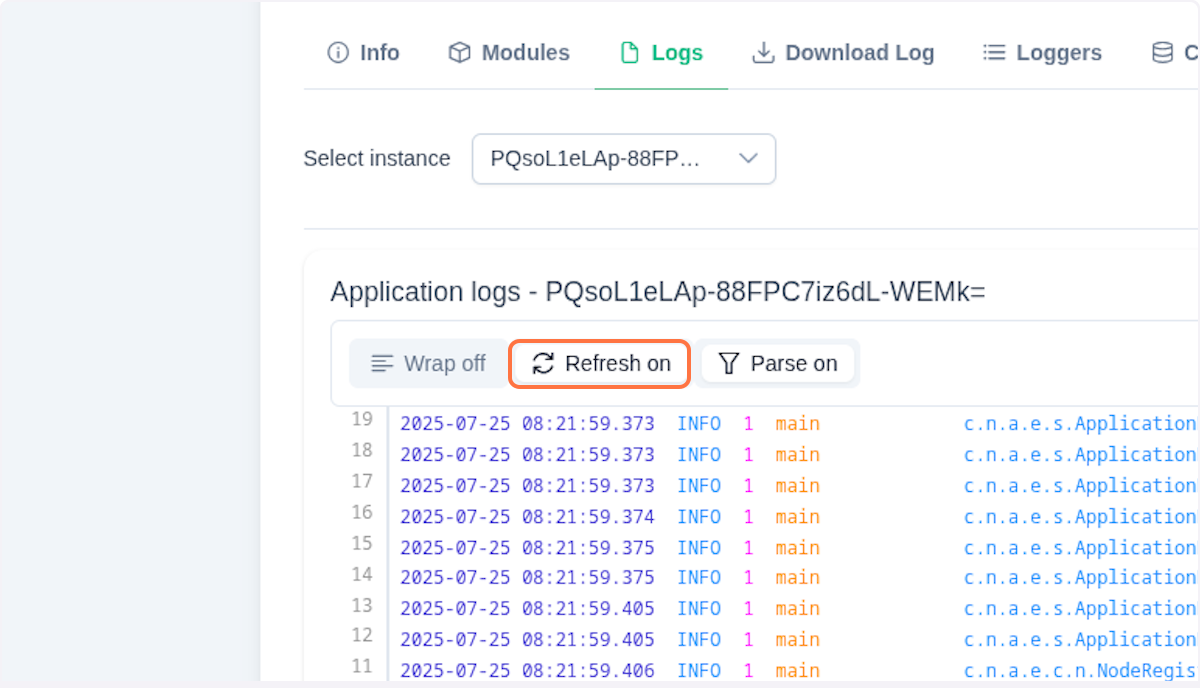
You can toggle synchronization of logs by clicking on the Refresh button. If you want to see the logs in raw format, click on the Parse button.
Loggers
By clicking on Loggers, you enter the logger view. Here you can change levels of all the available loggers in real-time.
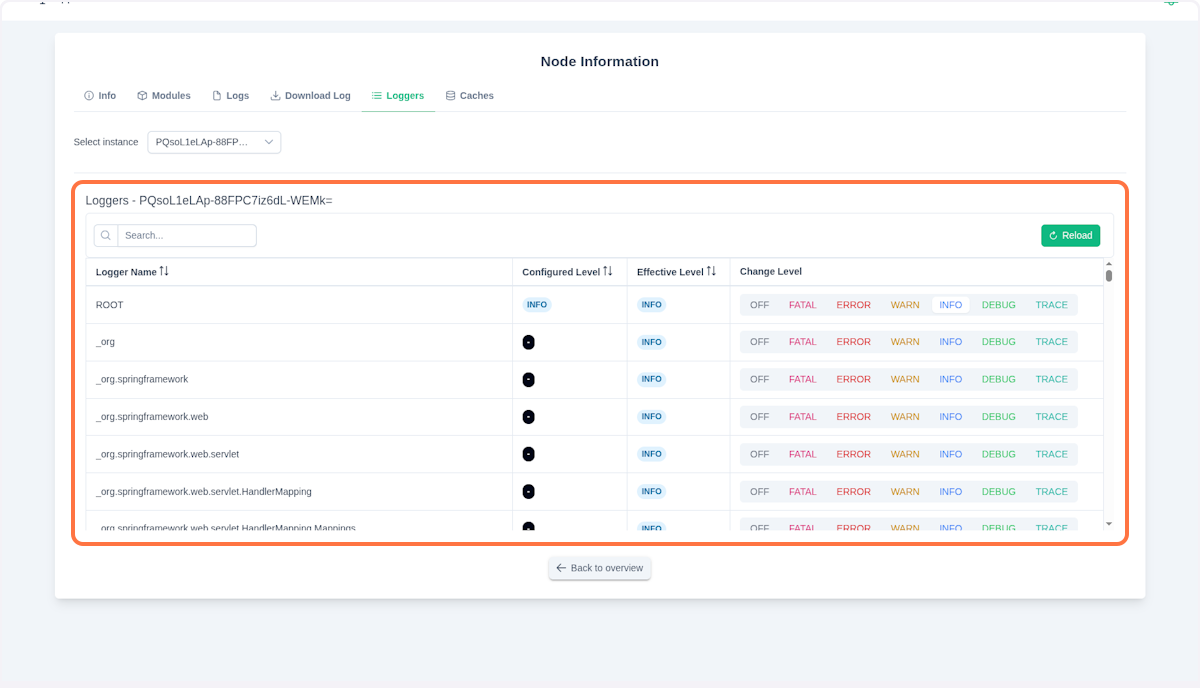
The Logger name column shows the Logback logger name (in most cases the canonical name of a Java class). The Configured Level column displays the logger's configured level, which you can change by clicking the level text in the last column.
The circle badge indicates whether the logger is turned off. When the badge is off, the logger is disabled and its messages do not appear in the logfile. Clicking the badge toggles the logger level or switches the logger on or off. The Effective Level column shows the actual logging level being used. This may differ from the configured level if the logger inherits its level from a parent logger.
NOTE
Logback supports these log levels:
![]()
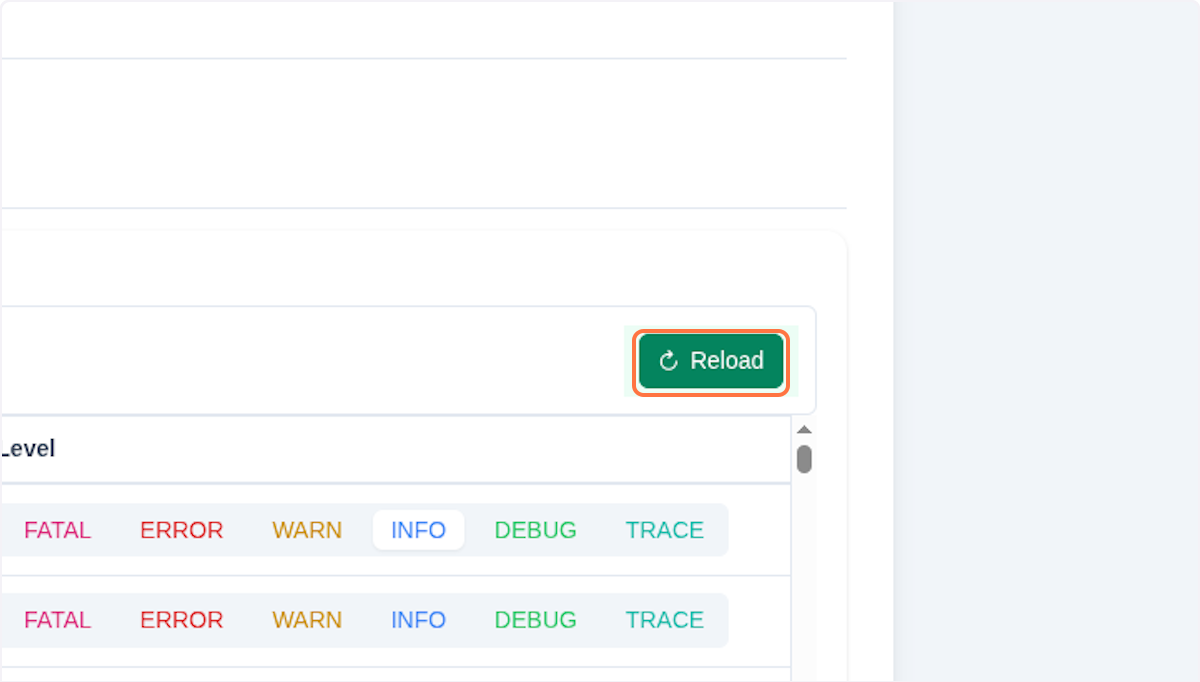
You can always refresh the logger list by clicking on the **Reload ** button.
Important
Currently, the logger view supports only Logfmt format. Overwriting logging configuration (for example via logback.xml) may break the Parse functionality in the logger view.
Caches
Worker nodes (and the Search Node) use a cache to store processes and tasks for faster reload time. If you need to clear the cache - either because the cached data has become corrupted or for any other reason - you can do so in the Caches tab.
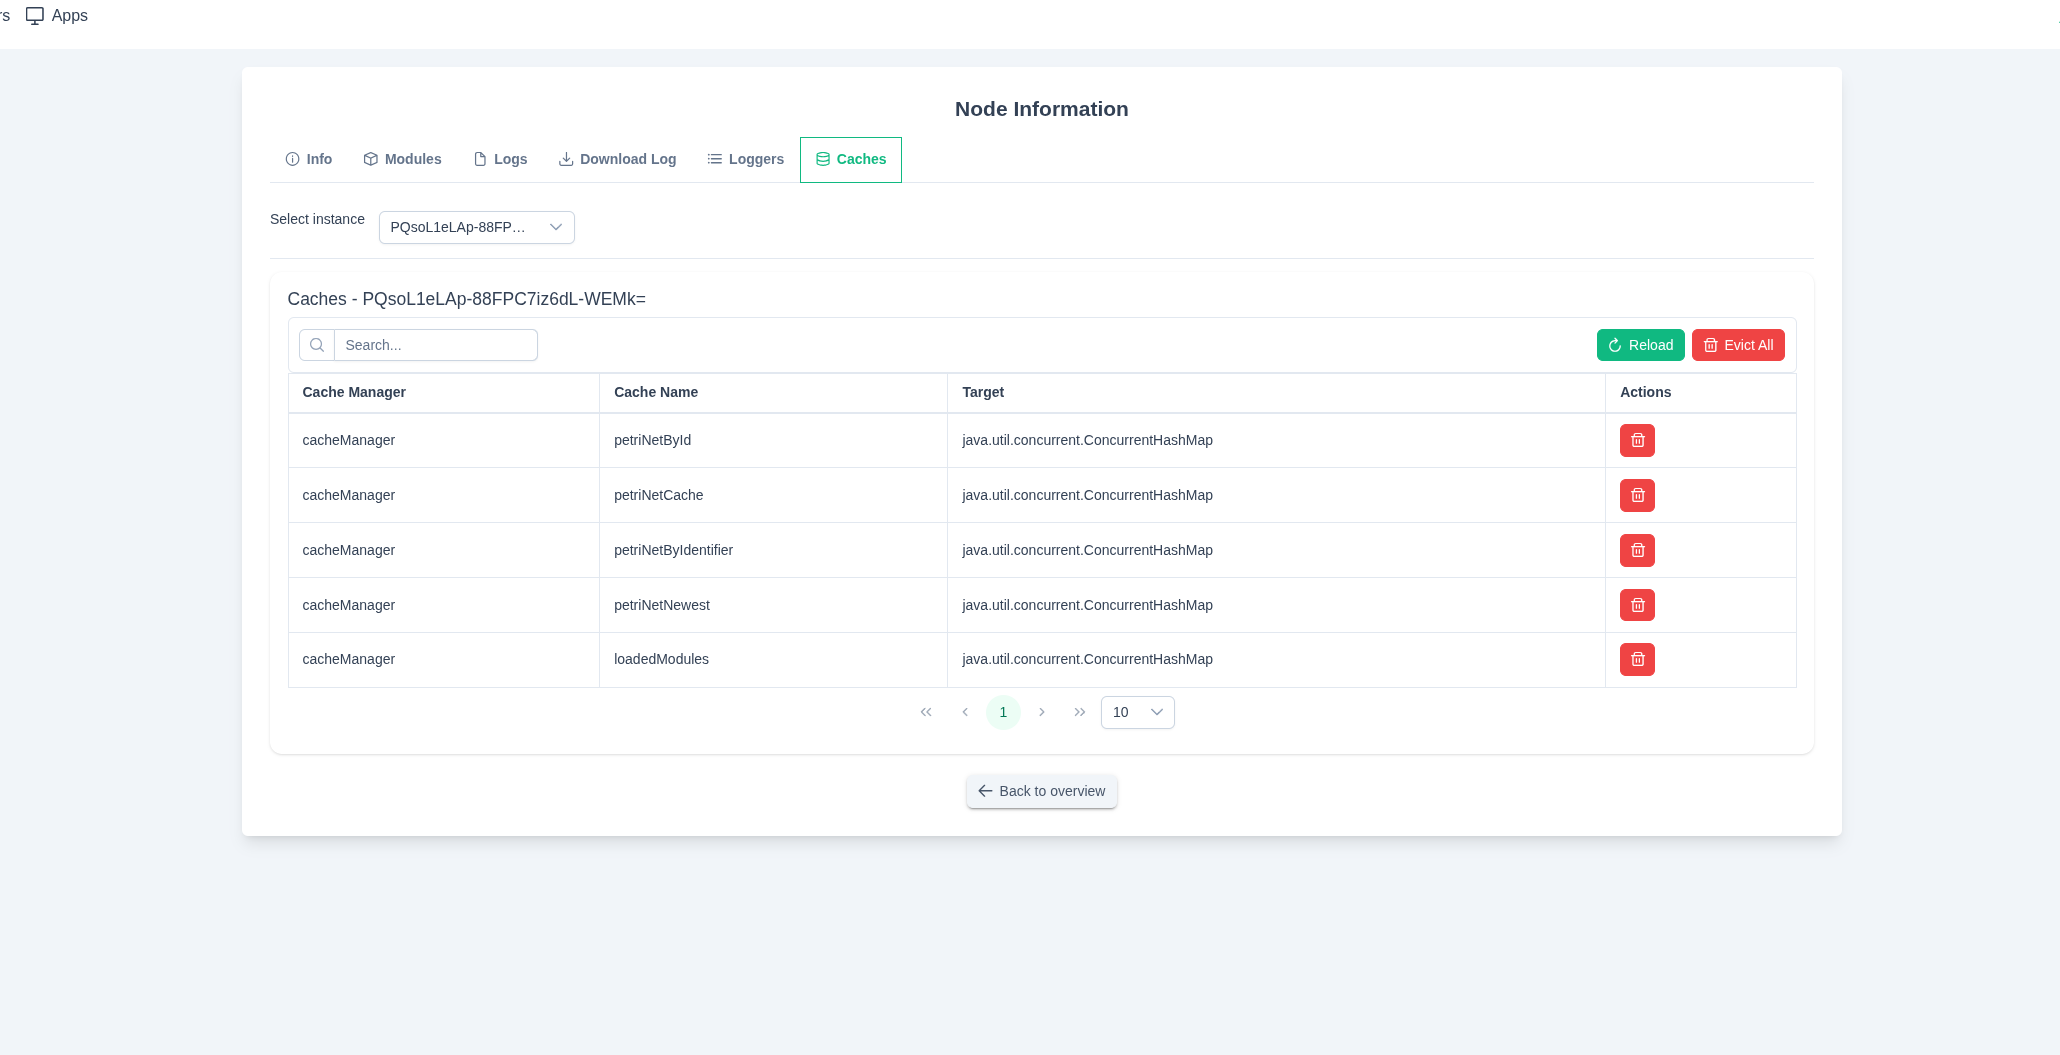
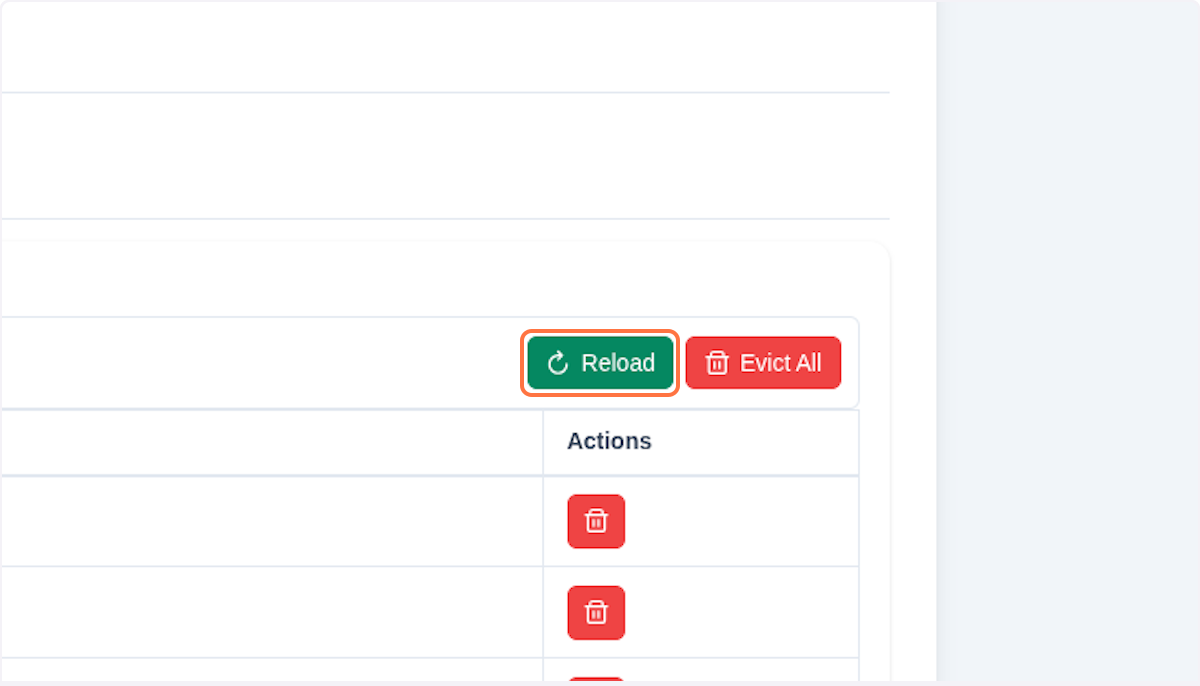
You can evict a cache by clicking the icon in the table entry, or evict all caches by clicking Evict All. You can also reload the table entries by clicking Reload.
Additional Node Details
Each node type fulfills different purposes, so there are different management tabs for a different node type.
Topology
In addition to the general tabs mentioned before, the Search and Gateway nodes include an additional tab: Topology. This tab displays two JSON files that represent the internal cluster topology. For the Search Node, the tab contains arrays of all available Elasticsearch indexes. While the Admin node continuously updates and distributes topology information across the cluster, this view allows administrators to verify search indexes and detect potential data discrepancies. For the Gateway node, the topology represents the entire cluster, thath means all nodes along with their hosts and ports. It also holds information about all processes that the node controls.
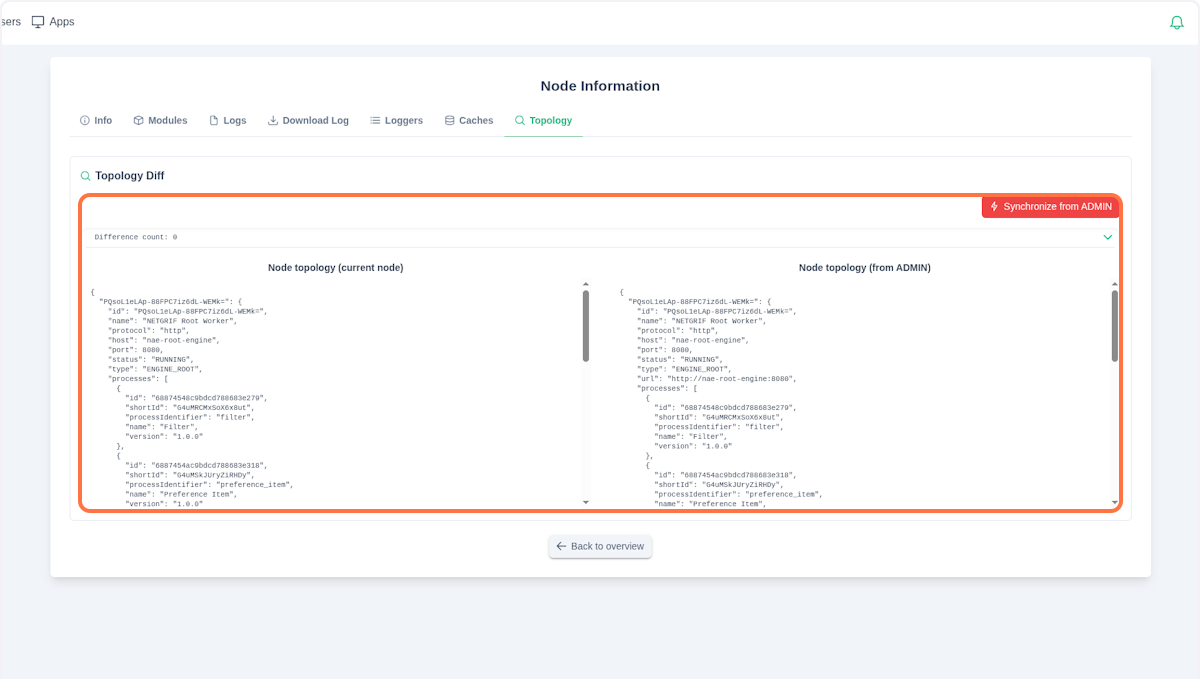
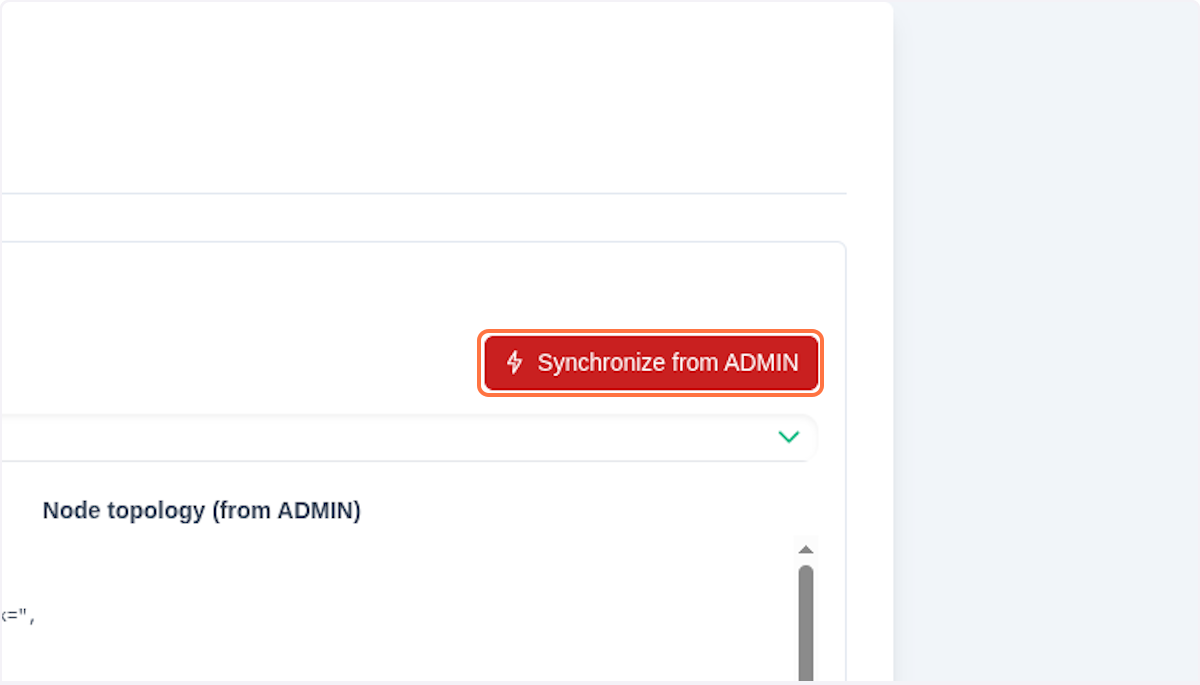
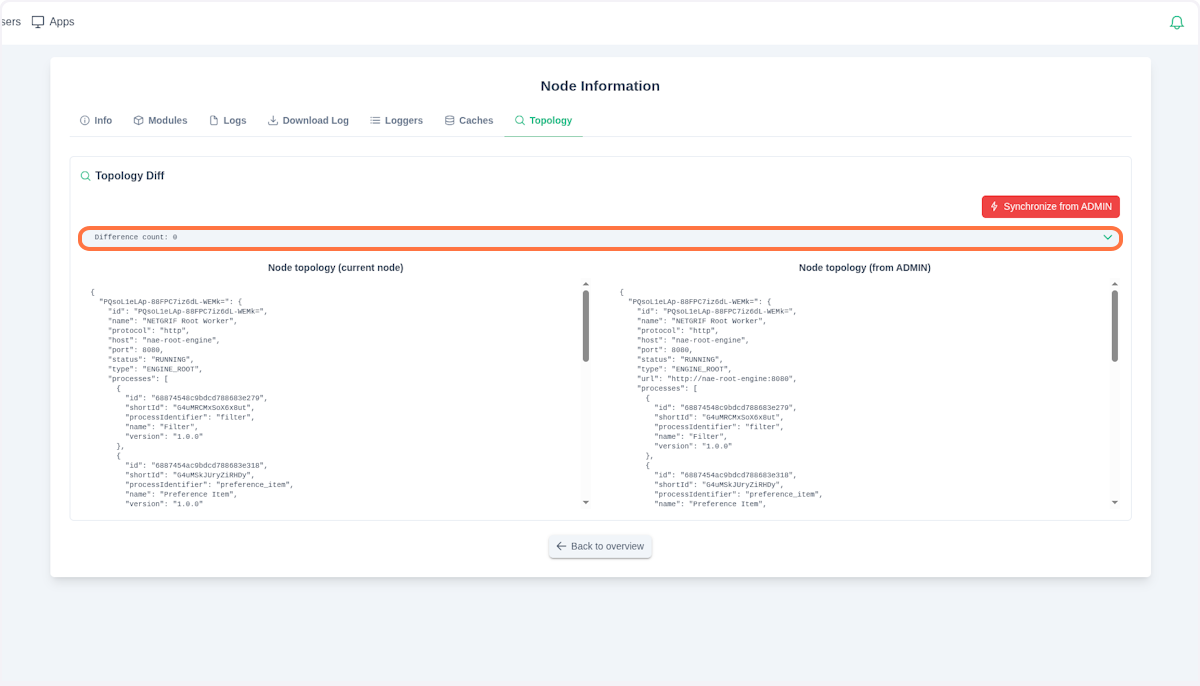
The column on the right shows the actual topology from the Admin node. The left column is the current topology. With this topology the node currently operates. We can enforce the new topology to the node by clicking Synchronize from ADMIN. We recommend doing this operation only if Difference count is not equal zero.
The Synchronize from ADMIN button sends its current topology into the currently selected node.